Your Rust Service Isn't Leaking — It Could Be the Allocator
While load testing one of our Rust services at work, we ran into something that took us way longer to figure out than we'd like to admit: memory that shoots up under load and just stays there.
Our service was event-driven:
- Read events from a message queue (Kafka/Redis Streams/NATS)
- For each event, spawn a Tokio task to process it
- Use a
Semaphoreto cap concurrent tasks to handle backpressure
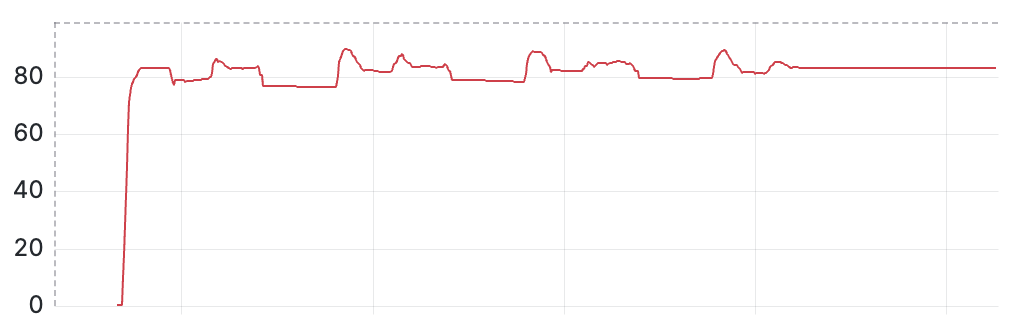
With this setup, we expected memory to come down once all the events are processed. But it stayed pinned near the top of the container limit.
Our Workload
We had a bursty and sparse workload with a frequency of 3-4 times per hour. Each burst had ~100k events. We ran our services as Kubernetes pods on an Ubuntu cloud VM.
Here is a much simpler version of the workload pattern we were dealing with.
struct Event {
    payload: Bytes,  // ~4KB
    user_tokens: Vec<String>, // up to 1000 tokens
    // other fields
}

...
// in main
let semaphore = Arc::new(Semaphore::new(100));

loop {
    let event: Event = fetch_next_event().await;
    let permit = semaphore.acquire_owned().await.unwrap();

    tokio::spawn(async move {
        let _permit = permit;
        let data = event.payload.clone();

        let mut tasks = JoinSet::new();
        for token in &event.user_tokens {
            let token = token.clone();
            let data = data.clone();
            tasks.spawn(async move {
                // hits an outbound API and returns response
                process(token, data).await
            });
        }

        let mut responses = Vec::with_capacity(event.user_tokens.len());
        while let Some(res) = tasks.join_next().await {
            responses.push(res)
        }

        generate_response_event(event, responses);
    });
}
The above code is written in a way which is easy to understand. We tried some code optimizations which reduced the peak memory usage but the memory pattern remained the same.
First Check: Is It a Rust Leak?
With the memory staying pinned, our immediate question was, is our code leaking somewhere?
With so many tasks being spawned aggressively, it was easy for us to imagine some of these tokio tasks to hang around longer than they should or memory getting accumulated somehow.
We used dhat to see if there were any memory leaks.
At t-gmax: 1,455,866,178 bytes (100%) in 1,321,561 blocks (100%), avg size 1,101.63 bytes
At t-end:  10,798 bytes (100%) in 26 blocks (100%), avg size 415.31 bytes
t-gmax tells about the peak heap memory consumption during entire program and t-end tells about the heap memory state as the program finishes executing.
The heap memory dropping from 1.4GB peak to 10KB confirms that the Rust program is freeing almost everything it allocates. But Kubernetes was still showing high RSS, which means the memory was still mapped into the process. The gap between those two numbers comes from how glibc's allocator manages freed memory.
glibc's Allocator
glibc's ptmalloc manages memory through arenas. Each arena allocates from one or more contiguous heap regions. For thread arenas, these regions are mmap-backed sub-heaps. The following is a simplified model of how the allocator works.
Allocation
When Tokio tasks are executed concurrently, the memory blocks for the tasks are laid out sequentially in these arenas, in the order they are requested. With Tokio's work-stealing, tasks can have memory allocated across arenas.
Arena 1
HEAP START ──────────────────────────────────────────────────────────► TOP CHUNK (top pointer)
[ Task A: String ] [ Task B: Vec ] [ Task A: Buffer ] [ Task C: Box ] [ Virtual expansion... ]

Arena 2
HEAP START ──────────────────────────────────────────────────────────► TOP CHUNK (top pointer)
[ Task B: Vec ] [ Task A: String ] [ Task C: Integer ] [ Task D: Vec ] [ Virtual expansion... ]
There is no boundary separating Task A's memory from Task B's memory. They are interleaved.
glibc allocates memory in these arenas only when allocation is below the mmap threshold. The default mmap threshold is 128KB, but glibc adjusts it dynamically up to 32MB on a 64-bit machine. Since most individual allocations in our workload were below the mmap threshold, they were handled inside glibc arenas instead of getting their own mmap regions.
De-allocation
glibc shrinks this contiguous heap region by trimming from the top. The OS can reclaim memory only when the free space is at the end of the heap. Allocations above the mmap threshold get their own mmap region and are cleanly returned via munmap when freed.
In the above, if Task B and Task C finish early and free their memory, it cannot be reclaimed by the OS. Task A, which is still alive and holding Buffer, acts as a deadbolt, pinning the current page and also trapping all the memory pages below it.
Arena 1
HEAP START ───────────────────────────────────────────► TOP CHUNK (top pointer)
[ Task A: String ] [ free ] [ Task A: Buffer ] [ free ] [ Virtual expansion... ]
glibc puts Task B and C's freed blocks across arenas into per-thread tcache or respective arena bins to reuse them for future tasks instead of returning it to the OS.
This in some cases creates heap fragmentation leading to gradually increasing or stair step memory graphs.
The flat memory in our memory graph is not solely due to any live allocation blocking the heap trim. In our service, we had no allocations that would stay live for a long time and we expected the memory to be returned to the OS after each burst, but RSS was held flat instead.
Why RSS Doesn't Drop
Though we had no long-lived allocations blocking heap trimming, the allocator still held on to the memory. This can happen when the last freed chunks are cached by the allocator and are not consolidated into the arena's reclaimable free space. With no allocation churn to trigger consolidation, those chunks can act like a blocker, leaving the memory stranded inside the allocator.
Thread arenas make this worse because they grow using mmap-backed sub-heaps. If the current sub-heap fills up, the arena can attach a new sub-heap and move the top pointer there. Automatic heap shrinking works from the top of the arena. If the top sub-heap still has unconsolidated chunks, older sub-heaps below it may remain mapped too, even if they are free.
Thread Arena
 ├── Sub-heap 1: free but held
 ├── Sub-heap 2: free but held
 └── Sub-heap 3: allocator still has free cached chunks not merged into top
Since our service was capped by Semaphore, RSS did not exceed the previous peak, making all the upcoming bursts reuse the free chunks/sub-heaps left behind by the previous burst. This kept our memory high and flat throughout.
Trimming Memory
We can ask glibc to return unused pages back to the OS by calling malloc_trim(0).
gdb -p 1 -batch -ex "call malloc_trim(0)"
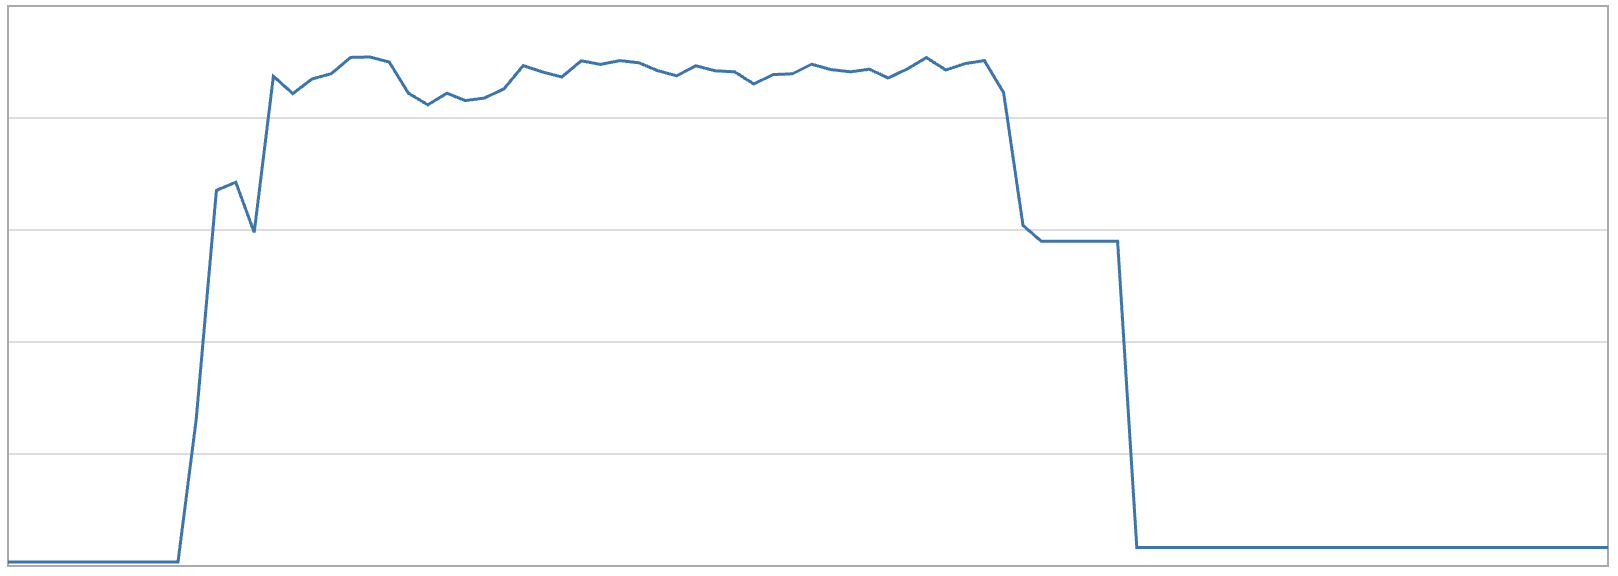
When we call malloc_trim(0) after the burst, our memory dropped to baseline instantly. We used this only as a debugging experiment, not as a production reclamation strategy. Our service was event-driven, so there was no clean deterministic point where we could safely call malloc_trim as part of the normal request path.
Switching to jemalloc
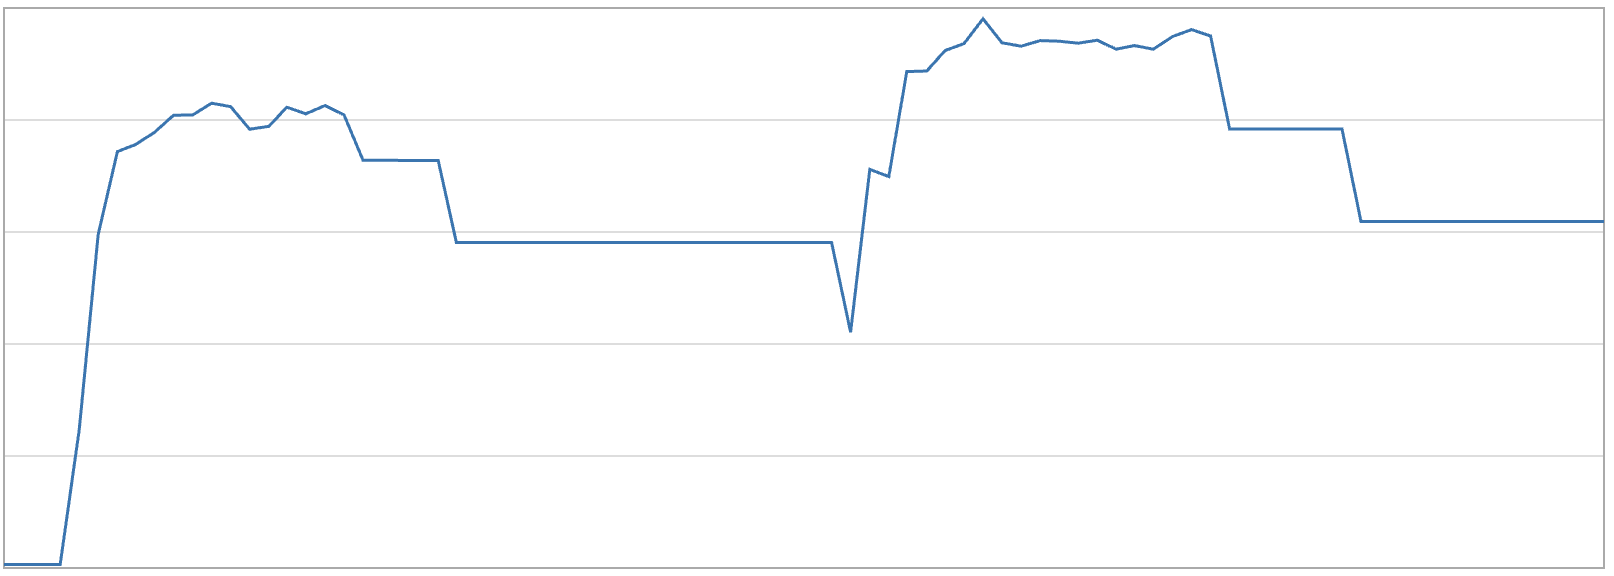
We then switched to jemalloc allocator and saw the memory settling after the burst.
#[global_allocator]
static GLOBAL: tikv_jemallocator::Jemalloc = tikv_jemallocator::Jemalloc;
Why jemalloc Works?
Jemalloc creates mmap-based, size-class-segregated per-thread arenas.
jemalloc arena
├── slab: 256B  → holds only 256B blocks
├── slab: 512B  → holds only 512B blocks
├── slab: 8KB   → holds only 8KB blocks
└── ...
When all slots in a 256B slab are freed, that page is fully empty. jemalloc marks it dirty and a background thread calls madvise telling the OS to reclaim the memory. This happens regardless of what the 8KB bin is doing.
glibc's core problem of one live chunk near the top of heap trapping everything below it, cannot occur in jemalloc. Each size-class slab lives and dies independently.
glibc:  [256B freed][8KB live][256B freed][256B freed] → all pinned

jemalloc: 256B slab: [free][free][free] → madvised, returned
          8KB slab:  [live]             → kept
By segregating size classes into independent slabs, it reduces the cross-size-class fragmentation. Within a single slab, a page is only returned once every slot in it is freed, so partial page occupancy can still hold pages with memory not being dropped.
jemalloc Configurations
In our build, jemalloc background threads were enabled through the tikv-jemallocator's background_threads feature. Some relevant allocator/runtime settings are:
Page size: 4096
thp: madvise
background_thread: true
dirty_decay_ms: 10000
muzzy_decay_ms: 0
jemalloc treats unused pages as dirty and purges them according to dirty_decay_ms. With background_thread enabled, this purging can happen asynchronously instead of waiting for future application allocation activity. Depending on platform support, purging may convert dirty pages into muzzy pages using mechanisms such as MADV_FREE, which lets the OS reclaim those pages under memory pressure. The muzzy_decay_ms setting controls how quickly unused muzzy pages are purged further.
Why not MiMalloc ?
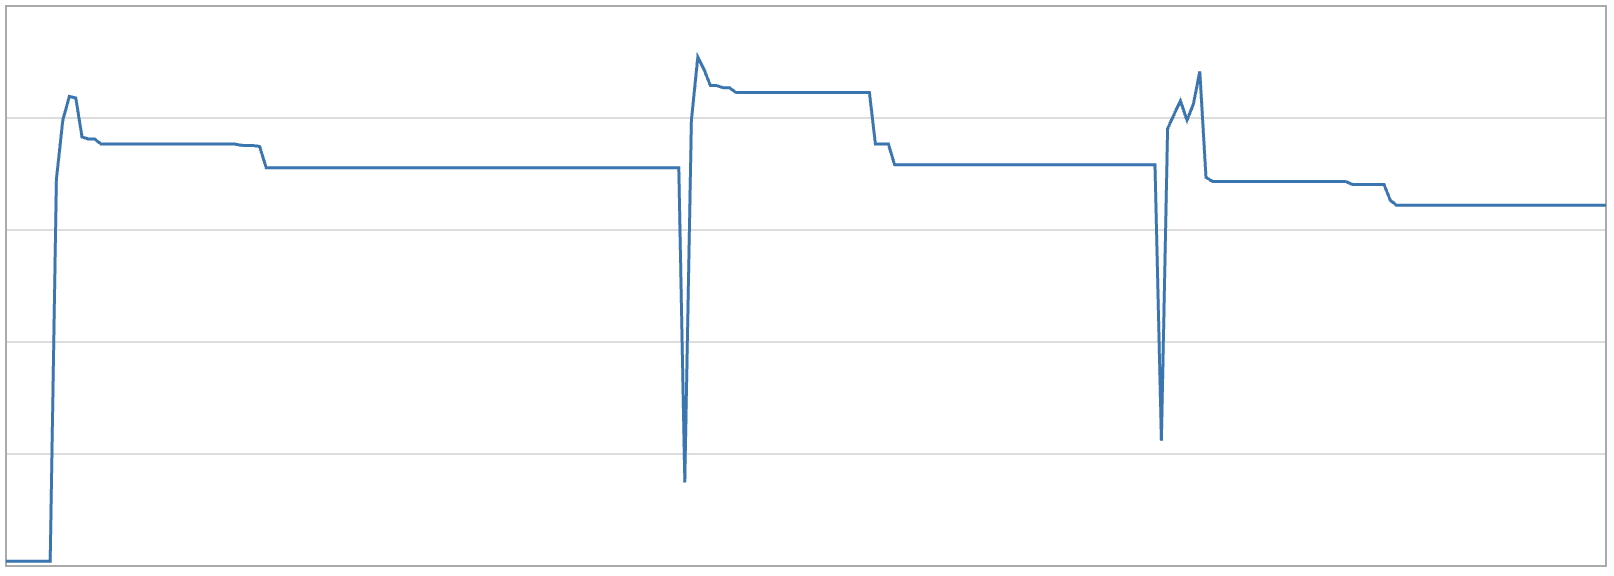
We also tried MiMalloc which is commonly recommended for high throughput services. But with MiMalloc we saw the memory being pinned at the top, similar to glibc, after the events were processed.
#[global_allocator]
static GLOBAL: mimalloc::MiMalloc = mimalloc::MiMalloc;
This happens due to how mimalloc interacts with Tokio's work-stealing scheduler:
- A task allocated on Thread A can be stolen and executed/dropped on Thread B.
- In mimalloc, cross-thread frees are pushed onto the owning page’s atomic
xthread_freelist, not immediately onto the normal local free list. - That
xthread_freelist is reconciled when the owning page is later revisited by allocator activity.
Since our workload is sparse, our Tokio workers went idle after each burst. Any blocks freed cross-thread could therefore remain on xthread_free longer, delaying page purge/decommit and keeping RSS flat.
Our production environment did have some allocation churn from health checks and metrics. When all Tokio workers are parked, Tokio does not wake them up randomly or round-robin across all of them. It just pops one sleeping worker from its sleepers list. So these tiny background tasks can keep waking a small set of workers, instead of creating allocator activity across all workers.
Configuring mimalloc
We also tried MIMALLOC_PURGE_DELAY=0 and MIMALLOC_PURGE_DECOMMITS=1 to make mimalloc return memory more aggressively. But these settings only control what happens after mimalloc has already recognized memory as free. They do not force pending cross-thread frees to be reconciled.
With the above configuration, RSS dropped a bit when the next burst started, likely because the new allocation activity revisited pages and reconciled the xthread_free lists. But the same burst immediately allocated more memory again, so RSS went back up quickly.
Conclusion
Though glibc is the default allocator and works well for the majority of applications, it can retain significant allocator-owned memory for bursty workloads due to arena reuse, fragmentation, and cached free chunks.
While mimalloc is designed for low-latency, high-throughput allocation patterns, its reclamation is tied to allocation activity. That made it a poor fit for our workload, where worker threads often went idle between bursts.
Jemalloc's background purging can return unused pages based on decay timers instead of relying only on future application allocation activity, which made it the right fit for our workload.
Thanks to Abhirag for fighting through this alongside me, debugging allocator behavior is not a solo sport 🙌